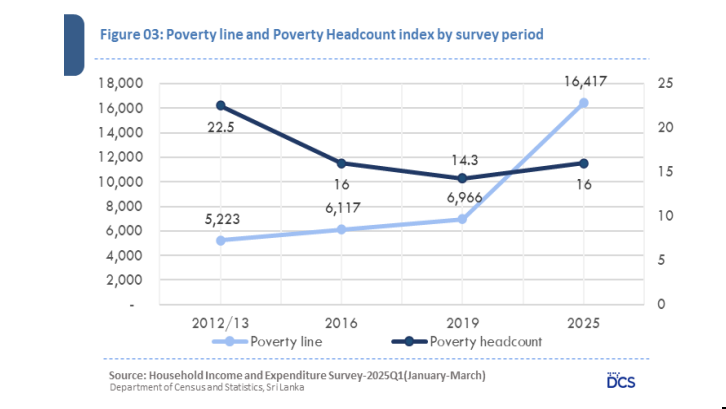
Sri Lanka’s poverty headcount index has risen to 16.0% of the population, up from 14.3% in 2019, wiping out roughly a decade of decline, according to preliminary findings from the Department of Census and Statistics’ Household Income and Expenditure Survey for 2025.
The figure places 3,419,069 people below the official poverty line — a threshold set for the survey at Rs. 16,417 per person per month, against Rs. 6,966 in 2019.
The reversal is the headline. The DCS series had fallen steadily from 22.5% in 2012/13 to 16% in 2016 and 14.3% in 2019 before turning back up. The department’s own bulletin says the increase of 1.7 percentage points “suggests a reversal of the previous declining trend in poverty”, EconomyNext reported.
Much of that movement is the measuring stick rather than the households. The poverty line itself rose roughly 2.4 times over the period, and the DCS cautions that “the substantial rise in the poverty line highlights the importance of accounting for changes in the cost of living when assessing poverty trends.”
The margin has nearly closed
The more striking number is what is left over at the end of the month. Average household income in the first quarter of 2025 was Rs. 120,266 against average spending of Rs. 116,191 — a margin of Rs. 4,075, or 3.4% of income.
In 2019 the same household earned Rs. 76,414 and spent Rs. 63,130, keeping Rs. 13,284, or 17.4%. The cushion has narrowed by about 69%, as spending rose 84% against a 57% rise in income, the Daily Mirror reported.
At the midpoint of the distribution the position has not merely narrowed but inverted. In 2019 median income (Rs. 53,333) exceeded median spending (Rs. 47,544) by Rs. 5,789. In 2025 median spending of Rs. 94,057 overtakes median income of Rs. 75,882 by Rs. 18,175. The two medians need not describe the same household, but the shift points to a larger share of families spending more than they report earning.
The DCS counts withdrawals from savings, bank deposits and provident funds as income — so these gaps persist after such drawdowns are already counted.
Where the squeeze falls
| Sector | Income | Spending | Left over | Poverty rate |
|---|---|---|---|---|
| Urban | Rs. 178,455 | Rs. 158,023 | +Rs. 20,432 | 7.8% |
| Rural | Rs. 110,613 | Rs. 108,918 | +Rs. 1,695 | 17.3% |
| Estate | Rs. 72,558 | Rs. 88,691 | −Rs. 16,133 | 23.0% |
Estate households spend more than they earn by over a fifth of their income, and carry the highest poverty incidence at 23.0%. Rural households, home to 2.93 million of the 3.42 million people below the line, retain Rs. 1,695 a month. Only urban households hold a meaningful margin.
Income remains heavily skewed: the poorest 20% of households averaged Rs. 22,612 a month against Rs. 335,679 for the richest 20% — a gap of nearly 15 times, the Daily FT reported. Mean household size was 3.4 persons.
Adjusted for prices, incomes are below 2019
In constant 2016 prices, real median household income fell 11.1% to Rs. 41,623, while real median expenditure rose 23.6% to Rs. 51,593 and real mean expenditure rose to Rs. 63,734 from Rs. 55,430. Real incomes are below where they stood before the crisis; real spending is above it.
The two filings disagree on one figure. Both put real mean income at Rs. 65,969, but the Daily FT describes that as a 7.8% fall from 2019 while the Daily Mirror calls it a 1.7% slip. The endpoint is agreed; the decline is not. The DCS attributes the sharper median fall to erosion of purchasing power being “more pronounced for the household at the midpoint of the income distribution”.
How provisional this is
These are preliminary results, and the caveats are substantial. They rest on the first-quarter sample only of the 25,000 households surveyed between January and December 2025, and are published only to sector level pending final validation.
The national poverty estimate carries a 95% confidence interval of 14.5% to 17.5%, with a coefficient of variation of 4.8%. Sampling variability is far higher for the sector splits — 18.0% for urban and 18.8% for estate on the poverty index — so those are the least reliable numbers in the release. District-level estimates come with the full-year report.
This is the eleventh survey in the series and the first since 2019. It was planned for 2022, deferred because of the economic crisis, and scheduled to follow the Population and Housing Census completed in 2024.
Arriving ahead of its own deadline
In October, officials told Parliament’s Committee on Public Finance that the HIES report had slipped from October to December 2026, citing data cleaning, computerisation delays and cadre vacancies. The Daily FT reports this bulletin was published in October 2026 — so the preliminary findings have reached the public ahead of the full report rather than instead of it.
The committee had also pressed the DCS on whether the consumer basket behind the poverty line is out of date. That question is now live against a hard number. Opposition Leader Sajith Premadasa, who in September challenged the government to a debate over poverty data vintages, told Parliament this week that the DCS had understated poverty by undercounting daily caloric requirements.
The survey line is not the current line
The Rs. 16,417 threshold is the one used for the survey period. The DCS’s separate monthly series has since risen to Rs. 17,742 per person in September 2026 — 8.1% above the survey line, with almost all of that increase coming in the past year, from Rs. 16,413 in September 2025. That monthly figure matches the series this desk has tracked since June.
For a household of 3.4 persons, the current line translates to roughly Rs. 60,300 a month to meet basic needs, against about Rs. 55,800 at the survey’s line.
The Daily Mirror puts the highest district line at Colombo, Rs. 19,136, and the lowest at Monaragala, Rs. 16,965. Readers should note that this desk has previously recorded a conflict on the lowest-district figure: a separate Daily FT filing gave Nuwara Eliya at Rs. 16,558 as the lowest, with Monaragala second at the same Rs. 16,965. That discrepancy is unresolved.
Not reported
The preliminary release does not show how households are covering these gaps. Figures on household debt were collected in the 2025 survey but are not part of this release.
No source gives district-level poverty rates, a date for the full-year report, or any breakdown by income source. None says whether the consumer basket questioned by the public finance committee was revised before these estimates were produced — a consequential omission, since changing the basket changes the line and therefore the measured poverty rate. Nor is there any government response to the figures, or any indication of what they imply for Aswesuma eligibility thresholds, which run off the same household data.
Sources
- Sri Lanka poverty rises to 16-pct as inflation drives living costs up — EconomyNext, November 6
- Sri Lanka average household spend nears Rs116k a month in 2025 — EconomyNext, November 6
- Poverty rises to 16% as real household incomes fall below 2019 levels — Daily FT, November 6
- Households left with just Rs.4,000 a month after spending — Daily Mirror, November 7
